Last updated: 2026-03-24
TL;DR
- Impressions measure exposure, not interest, intent, or revenue.
- Pipeline contribution and revenue attribution are the only metrics the board cares about.
- Most agencies report impressions because they are easy to inflate and hard to challenge.
- A proper measurement framework connects every marketing pound to a business outcome.
- Start by mapping your funnel stages to revenue, then work backwards to find what drives deals.
What Makes a Metric a Vanity Metric?
A vanity metric is any number that looks impressive in a slide deck but never changes a business decision. It climbs, people nod approvingly. It dips, nobody does anything differently. The metric exists to make marketing look productive without proving that it is.
A metric is only useful if it changes what you do next. If impressions doubled last month, what would you actually do about it? Nothing, most likely. If pipeline contribution from paid search fell 30%, you would have an emergency meeting within the hour. That distinction matters.
Impressions, reach, raw page views, social media followers, and email list size all share this trait. They describe volume, not value. Activity, not outcomes.

None of these numbers are worthless in every context. Reach matters for awareness campaigns. Page views matter when paired with conversion data. The problem begins when they become the headline metric in a board report, positioned as evidence that marketing is doing its job.
According to Gartner’s 2025 CMO Spend Survey, 72% of CMOs reported pressure to demonstrate marketing’s direct contribution to revenue, up from 58% in 2022. The C-suite is not asking “how many people saw our ad.” They want to know how many deals marketing influenced, and what those deals cost to win.
Why Impressions Specifically Are the Worst Offender
Impressions count every time an ad is served. Not seen. Not read. Not considered. Served. A banner that loads below the fold where nobody scrolls counts as an impression. A video that autoplays in an inactive browser tab counts as an impression. A display ad rendered beside spam content on a made-for-advertising site counts as an impression.
The Association of National Advertisers (ANA) found in their 2023 Programmatic Media Supply Chain Transparency Study that roughly 23% of programmatic ad spend went to made-for-advertising (MFA) sites. These sites exist solely to generate impressions. They produce no real audience engagement. Your impression count climbs, your pipeline stays flat, and your agency shows you a chart with a reassuring upward trend.
The Inflation Problem
Impressions are the easiest metric in marketing to inflate without improving business results. Want more? Lower your targeting criteria. Broaden the audience definition. Run ads on cheaper placements. Buy programmatic inventory in bulk. Your CPM drops, your impression count rockets upward, and your CFO still asks why marketing cannot demonstrate its contribution to revenue.
We have seen this pattern play out consistently across 15+ years in digital marketing. One client approached us after their previous agency reported 45 million impressions per quarter on a £12,000 monthly spend. The numbers were technically real. The agency had run display ads across the Google Display Network with almost no audience targeting, zero placement exclusions, and no frequency caps. Impressions were enormous. Leads from those campaigns: 3 per quarter. Three.
The Attribution Gap
Even when impressions are legitimate, the distance between “someone was served this ad” and “someone bought our product” is so vast that treating impressions as evidence of marketing effectiveness is like treating a restaurant reservation as proof of a good meal. One is a precondition. It is not a proof point.
Research from Google’s Think with Google (2025) noted that fewer than 5% of display ad impressions result in any measurable downstream action, including clicks, site visits, or conversions. The other 95% disappear into the chasm between served and seen, seen and remembered, remembered and acted on.
What C-Suite Leaders Should Measure Instead
Impressions sit at one end of the measurement spectrum: all volume, no value. Revenue sits at the other. But jumping straight from impressions to revenue attribution without building the intermediate stages leaves you blind to where your funnel breaks. Here is the framework we use with clients through our Strategy & Growth engagements.
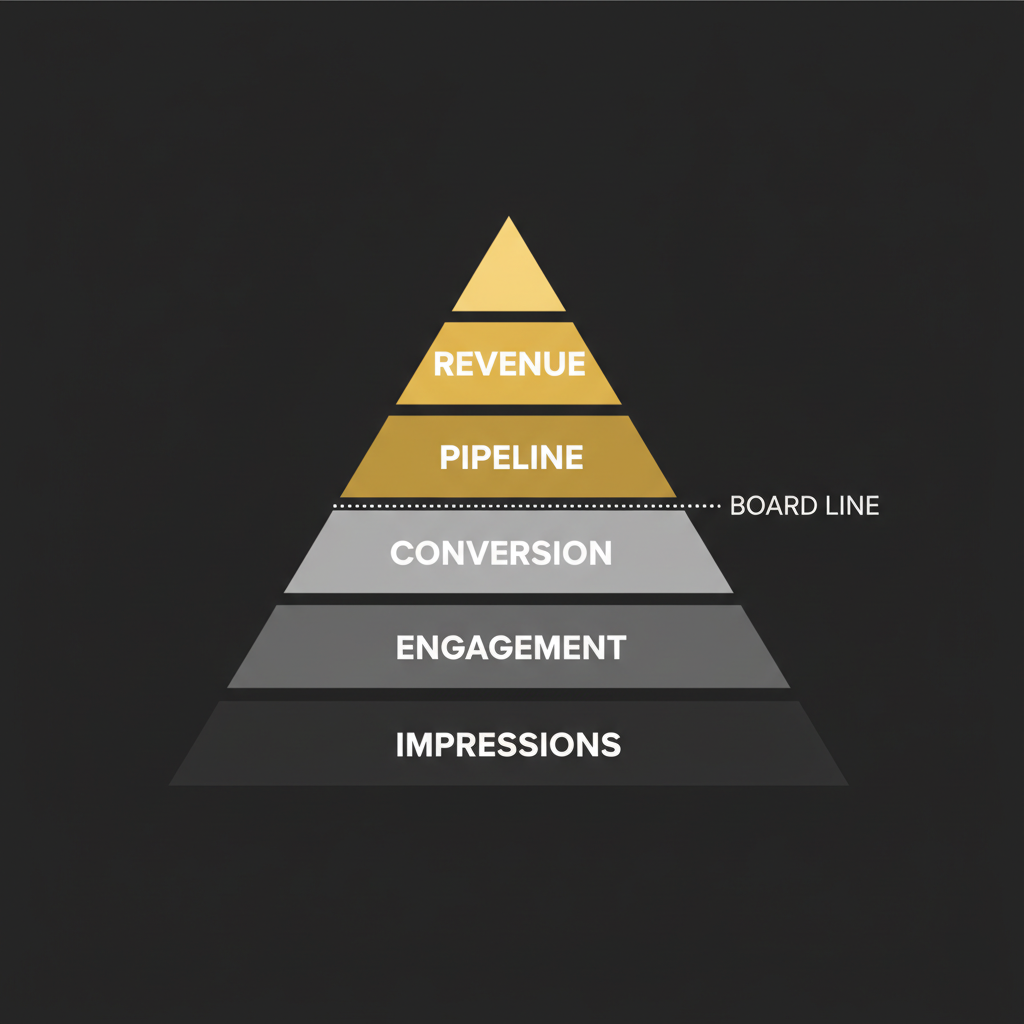
The Pipeline-Revenue Measurement Hierarchy
| Level | Metric | What It Tells You | Who Cares |
|---|---|---|---|
| 1 (Vanity) | Impressions, Reach, Followers | How many people were exposed | Nobody at board level |
| 2 (Engagement) | CTR, Time on Site, Bounce Rate | Whether exposure created interest | Marketing managers |
| 3 (Conversion) | MQLs, SQLs, Demo Requests, Trial Starts | Whether interest created intent | Marketing directors, VP Sales |
| 4 (Pipeline) | Pipeline Created, Pipeline Influenced, Pipeline Velocity | Whether intent created commercial opportunity | CMO, CRO |
| 5 (Revenue) | Closed Won Revenue, CAC, LTV:CAC, Payback Period | Whether opportunity became profit | CEO, CFO, Board |
Pipeline Created measures the total value of new sales opportunities that marketing sourced or influenced during a given period. Pipeline Influenced counts every deal where marketing had a measurable touchpoint, even if sales originated the lead. Pipeline Velocity tracks how fast deals move through stages, revealing whether your marketing is accelerating the buying process or clogging it.
Why Pipeline Beats Revenue as the Primary Marketing KPI
Revenue attribution is the gold standard, but it has a timing problem. In B2B, sales cycles commonly run 3 to 12 months. If you only measure revenue, you are evaluating campaigns that finished months ago. Pipeline metrics give you a leading indicator. They tell you what revenue will look like in 90 days, not what happened 90 days ago.
Forrester’s B2B Revenue Waterfall framework (updated 2024) specifically recommends pipeline as the connective tissue between marketing activity and revenue outcomes. The model maps how impressions become inquiries, inquiries become marketing-qualified leads, and MQLs progress through sales stages to closed revenue. That is the kind of rigour that separates real marketing leadership from report decoration.
How to Build a Pipeline-First Measurement Framework
This is not theoretical. Below is the practical process we walk clients through, typically during a Fractional CMO engagement, to shift from vanity reporting to revenue-connected measurement.
Step 1: Define Your Revenue Model
Start at the end. What is your average deal size? What is your close rate from proposal to signed contract? How many proposals do you need to hit your revenue target? Work backwards from the annual revenue goal to the number of qualified opportunities required per month. That figure becomes your pipeline target.
Step 2: Map Every Funnel Stage
Between a first marketing touchpoint and a closed deal, there are stages. Name them. Define them. Assign conversion rates to each based on historical data, not assumptions. A typical B2B map looks like: Visitor > Lead > MQL > SQL > Opportunity > Proposal > Closed Won.
Each stage needs a single, unambiguous definition. An MQL is not “someone who filled in a form.” An MQL is “a lead that meets our ICP criteria (industry, company size, job title) and has taken at least two high-intent actions within 14 days.” Specificity prevents arguments between marketing and sales about lead quality.
Step 3: Instrument Your CRM and Analytics
Your CRM, whether that is HubSpot, Salesforce, or Pipedrive, must track the source and every marketing touchpoint for each deal. Set up UTM parameters rigorously. Implement server-side tagging in GA4 to reduce data loss from cookie consent. Connect your ad platforms to your CRM through native integrations or tools like Supermetrics or Funnel.io.
If your CRM does not track marketing source at the deal level, stop everything else and fix this first. You cannot measure pipeline contribution when you cannot see which pipeline marketing actually touched.
Step 4: Build Your Attribution Model
For most businesses under £10M revenue, a simple first-touch and last-touch dual model works well enough to start. First-touch shows you which channels create initial awareness. Last-touch shows you which channels close deals. Run both. Compare them. The channels that appear strongly in both are your workhorses.
Once you have the data maturity, move to a multi-touch model that assigns fractional credit across every touchpoint. Tools like HubSpot’s multi-touch attribution, Ruler Analytics, or Dreamdata can handle this without requiring a dedicated data science team. We cover the fundamentals of this approach in our attribution modelling glossary entry.

Step 5: Replace Your Dashboard
Kill the old dashboard. Build a new one with three views:
- Executive view: Pipeline created, pipeline influenced, CAC, revenue attributed to marketing, LTV:CAC ratio. One page. Updated monthly.
- Marketing leadership view: Conversion rates by funnel stage, channel-level pipeline contribution, cost per MQL, cost per SQL, pipeline velocity. Updated weekly.
- Tactical view: Campaign-level performance including CTR, CPA, landing page conversion rates. Updated as needed by the team running campaigns.
Impressions belong in the tactical view. They are fine as a diagnostic data point for people managing individual campaigns. They should never appear in the executive view.
The Uncomfortable Reason Agencies Report Impressions
This is the part most marketing blogs omit. Agencies report impressions not because they are the best metric, but because they are the safest metric. Impressions always go up if you spend money. They require no accountability for business outcomes. And they are nearly impossible for a non-expert client to challenge.
We have reviewed reporting decks from agencies charging anywhere from £5,000 to £50,000 per month. The pattern is remarkably consistent. Page one: impressions (big number, green arrow). Page two: clicks (smaller number, still green). Page three: “engagement metrics” like time on site or social interactions. Page four, when it exists at all: leads. Revenue? Almost never mentioned.
This is not always malice. Plenty of agencies genuinely lack the technical setup or CRM access to report on pipeline. But that is precisely the problem. If your marketing partner cannot tell you how their work affects your revenue, they are managing activity, not outcomes. That distinction sits at the core of our three-pillar methodology: we build measurement capability inside your team so you can see the truth without depending on someone else’s interpretation.
A HubSpot State of Marketing report (2025) found that only 35% of marketers felt “very confident” in their ability to prove ROI. The remaining 65% are, to varying degrees, guessing. And when people guess, they gravitate towards the metrics that make the guess look good.
When Impressions Actually Matter (and When They Don’t)
Blanket dismissal would be as lazy as blanket acceptance. Impressions do carry weight in specific scenarios. Here is a breakdown of when they are useful and when they are noise.
| Scenario | Impressions Useful? | Why |
|---|---|---|
| Brand awareness campaign for a new market entry | Partially | Useful as a reach indicator, but must pair with aided/unaided recall studies to prove impact |
| Share of voice analysis vs. competitors | Yes | Impression share in paid search shows competitive positioning in a specific auction |
| Diagnosing low CTR | Yes | High impressions + low CTR suggests targeting or creative problems |
| Board-level marketing report | No | Does not connect to revenue or pipeline |
| Proving campaign effectiveness | No | Impressions alone prove nothing about effectiveness |
| Justifying budget increases | No | CFOs are not impressed by eyeball counts |
The takeaway: impressions serve as a diagnostic metric, useful within campaign management contexts. They become a vanity metric the instant they are presented as a success metric to stakeholders who need to understand business impact.
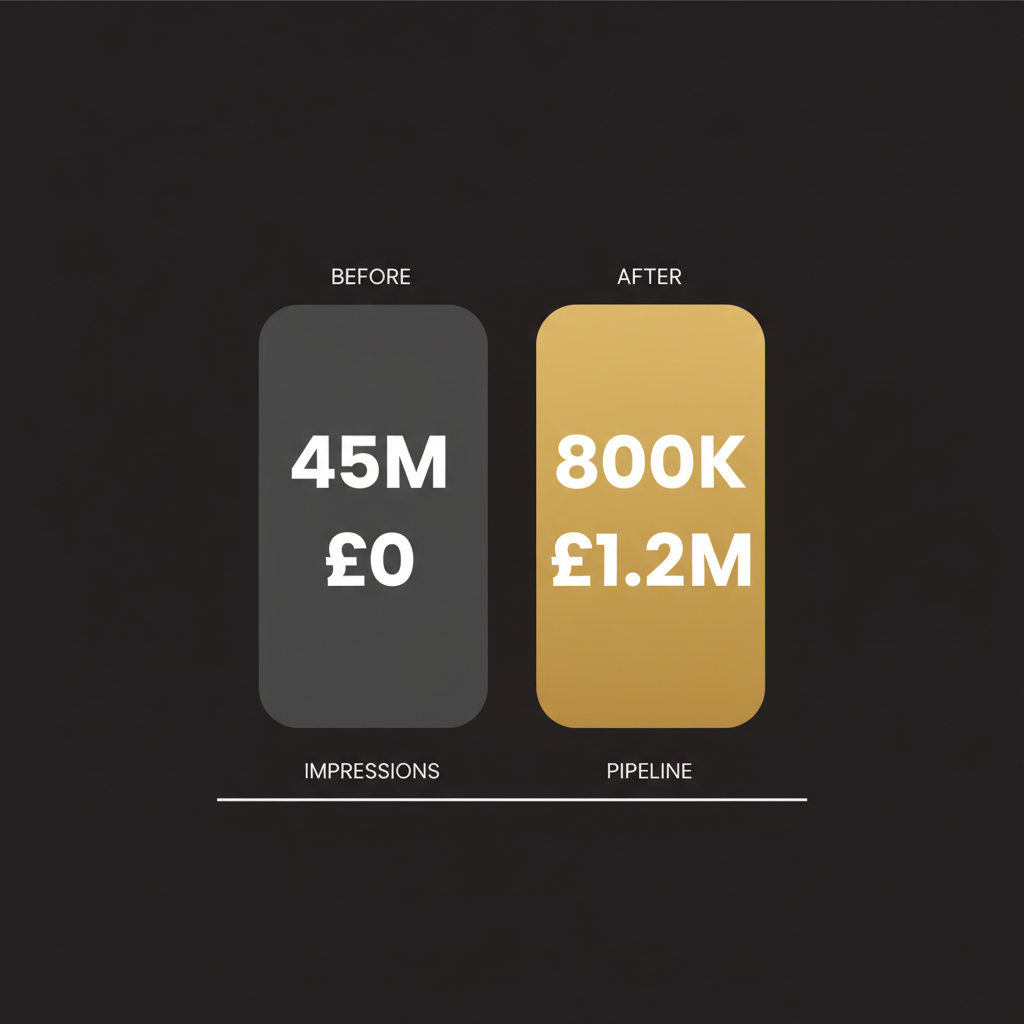
A Practical Example: From 45 Million Impressions to £1.2M Pipeline
One of our clients, a B2B SaaS company with around £3M ARR, came to us with a story we have heard too many times. Their agency was reporting 45 million display impressions per quarter and positioning this as a win. Monthly spend sat at £12,000. Leads generated from display: 3 per quarter, none of which converted to pipeline.
We rebuilt their measurement and channel strategy from scratch.
First, we killed display entirely and redirected budget to paid search and LinkedIn, targeting high-intent keywords and decision-maker job titles. Second, we instrumented HubSpot to track every touchpoint from first click to closed deal. Third, we set up weekly pipeline reviews with the sales team, examining marketing-sourced and marketing-influenced pipeline rather than impressions.
Within two quarters, impressions dropped from 45 million to roughly 800,000. On an impressions-based report, that looks catastrophic. But pipeline sourced by marketing went from £0 to £1.2M. Cost per SQL dropped from unmeasurable (because they had never tracked SQLs) to £340. The CEO could see, for the first time, exactly what marketing was producing.
How to Start This Week
You do not need a six-month transformation programme to begin measuring what matters. Here are five actions you can take this week.
- Audit your current reporting. Open your last three marketing reports. Count how many metrics connect directly to revenue or pipeline. If the answer is zero, you have found the problem.
- Define one pipeline metric. Pick “pipeline created by marketing” as your North Star. Define what qualifies: the monetary value of new deals where marketing was the first or last touchpoint before a sales conversation.
- Check your CRM. Can you see the original marketing source on every deal record? If not, fix this before spending another pound on campaigns.
- Ask your agency the hard question. “What pipeline or revenue did your work generate last quarter?” The response will tell you everything about how they think about accountability.
- Remove impressions from your executive dashboard. Not from your campaign dashboards, just from the board-level view. Force the conversation about what replaces them.
If your marketing team or agency struggles to answer the pipeline question, that is not a minor gap. It is a structural problem with how your marketing function operates. It is also the kind of problem that a Fractional CMO engagement is built to solve: constructing the measurement architecture, aligning marketing and sales on shared definitions, and shifting the culture from activity reporting to outcome reporting.
Frequently Asked Questions
Are impressions always a vanity metric?
Not always. Impressions serve a diagnostic purpose inside campaign management, for example when analysing CTR or impression share against competitors. They become a vanity metric when they are presented to stakeholders as evidence of marketing success without any connection to pipeline or revenue outcomes.
What should replace impressions in a marketing report?
Pipeline created by marketing, pipeline influenced by marketing, customer acquisition cost (CAC), and revenue attributed to marketing. These metrics connect marketing activity to business results. Impressions can remain in tactical campaign dashboards for the team managing those campaigns.
How do I calculate pipeline contribution from marketing?
Track the marketing source of every deal in your CRM. Pipeline created by marketing is the total value of deals where marketing was the originating touchpoint. Pipeline influenced includes deals where marketing had any measurable touchpoint, even if sales originated the lead. Both numbers matter.
What tools do I need for pipeline-based marketing measurement?
At minimum, a CRM that tracks deal source (HubSpot, Salesforce, or Pipedrive), properly configured UTM tracking on all campaigns, and GA4 with conversions set up. For multi-touch attribution, tools like Ruler Analytics, Dreamdata, or HubSpot’s built-in attribution reporting can assign fractional credit across touchpoints without requiring a data science team.
Why do agencies report impressions instead of revenue metrics?
Impressions always increase when you spend money, making them a safe metric that is almost impossible to fail. Many agencies also lack the CRM access or technical setup needed to track pipeline. Reporting impressions protects the agency from accountability for business outcomes.
Is it worth measuring brand awareness at all?
Yes, but not through impressions alone. Brand awareness is best measured through aided and unaided recall studies, branded search volume trends, and share of voice analysis. These methods connect awareness to actual recognition and recall, not just ad serving.
How long does it take to shift from impression-based to pipeline-based reporting?
The technical setup, including CRM configuration, UTM tracking, and dashboard rebuilding, can be completed in 2 to 4 weeks. The harder part is cultural. Getting marketing and sales to align on shared definitions of MQL, SQL, and pipeline attribution typically takes 1 to 2 quarters of consistent reinforcement.
What is the difference between pipeline created and pipeline influenced?
Pipeline created counts deals where marketing was the first touchpoint, meaning marketing sourced the lead. Pipeline influenced counts all deals where marketing had any touchpoint during the buyer journey, even if the lead came through sales outreach or referrals. Tracking both gives you a complete picture of marketing’s commercial contribution.
Ready to Measure What Actually Matters?
If your marketing reports are full of impressions but empty on pipeline, we can fix that. We build measurement frameworks that connect every marketing pound to a business outcome, then transfer the capability to your team so you never depend on an external partner to tell you what is working.